Statement of Activities
Cornell’s Actual Current-Year Performance
The Statement of Activities records Cornell’s financial performance over a fiscal period. It details operating revenues, operating expenses, non-operating revenues and expenses, and changes in net assets. This report includes pledges, depreciation, and accruals (non-cash, long-term liabilities), and subsidiary income and expenses. In contrast, the Operating Budget includes cash payments on pledges, debt repayments, and omits accruals.
Operating Revenues: Cornell’s Mission-Related Income
Operating revenues include anticipated earnings related to Cornell’s mission of "learning, discovery, and engagement" along with services that support students and campus operations.
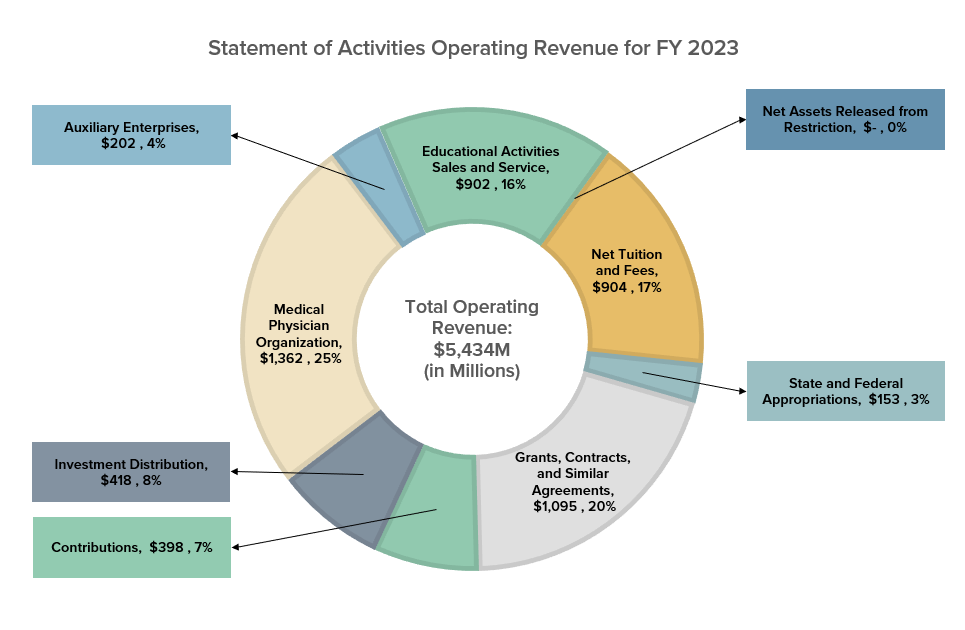
The most significant sources of operating revenue are tuition and fees after institutional grant aid, clinical practice income Weill Cornell Medicine, and government corporate, or private foundation funding for mission-related activities.
Net Tuition and Fees: Student Tuition After Scholarship Allowance
Amount: $904M (FY 2023)
Net tuition and fees represent consideration received from students or participants in exchange for instruction or course credit, net of a scholarship allowance.
Scholarship allowance (financial aid) is reclassified from expense to contra revenue, reducing tuition revenue for financial aid up to the total amount of tuition per student.
Financial aid is not allocated to auxiliary services or educational revenue (housing, dining, student health insurance, etc.).
Historical Tuition Rates
| College | 2022-2023 | 2021-2022 | 2020-2021 | 2019-2020 |
|---|---|---|---|---|
| Endowed Ithaca | $62,456 | $60,286 | $58,586 | $56,550 |
| Contract College - Resident | $41,958 | $40,382 | $39,244 | $37,880 |
| Contract College – Nonresident | $62,456 | $60,286 | $58,586 | $56,550 |
| Medical Campus | $64,500 | $62,650 | $61,110 | $58,760 |
| Business | $76,690 | $74,026 | $71,940 | $69,440 |
| Law | $74,098 | $71,522 | $70,188 | $67,748 |
| Veterinary Medicine | $39,900 | $39,206 | $38,250 | $37,136 |
Fall Enrollment Totals
| Class | 2022-2023 | 2021-2022 | 2020-2021 | 2019-2020 |
|---|---|---|---|---|
| Undergraduate | 15,735 | 15,503 | 14,743 | 15,043 |
| Graduate | 8,146 | 8,021 | 7,122 | 7,169 |
| Professional | 3,344 | 3,429 | 3,077 | 3,142 |
| Total Fall Enrollment | 27,225 | 26,953 | 24,942 | 25,354 |
State and Federal Appropriations
Amount: $153M (FY 2023)
Appropriations are typically awarded based on legislation and not through an application process.
State appropriations are funds distributed through the State University of New York (SUNY).
Federal appropriations are funds distributed through various federal agencies for land grant institutions like Cornell, used for agricultural education and research, other special research projects, and extension activities.
Federal financial aid, such as Pell grants and Perkins loans, is “passed through” Cornell and not considered revenue. This funding is recorded as either a payment on a receivable or as a liability.
Grants, Contracts, and Similar Agreements: Sponsored Funding
Amount: $1,095M (FY 2023)
Also known as sponsored programs revenue, grant and contract revenue is:
- Generated from an external entity, such as a governmental agency, a corporation, or private foundation.
- Recorded as sponsored revenue when it is for an activity with a defined budget, a period of performance, and a scope of work undertaken by the university. Outcome expected to directly benefits the resource provider.
- Earned and recognized when expenses have been incurred, except as otherwise provided for in the terms and conditions of the award.
Sponsored Funding by Major Source
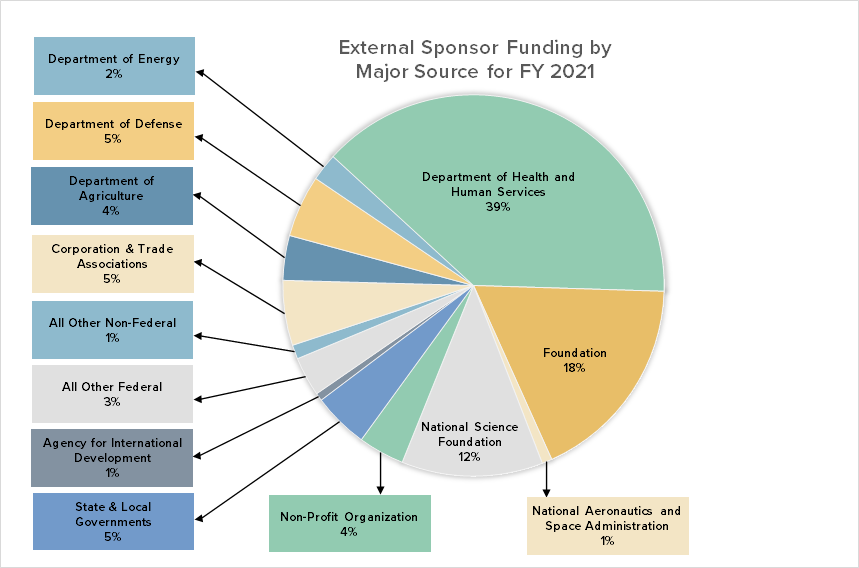
The majority of sponsored funding for research and mission-related activities comes from the federal Department of Health and Human Services, the National Science Foundation, and non-federal foundations.
Contributions: Cash Gifts and Pledges
Amount: $398M (FY 2023)
Contributions or gifts include outright cash gifts and pledges (promises to give) to the university. These contributions, including unconditional promises to give, are recognized as revenues in the appropriate categories of net assets in the periods received.
A pledge is recorded at the present value of estimated future cash flows, based on an appropriate discount rate determined by management at the time of the contribution.
A contribution of assets other than cash is recorded at its estimated fair value on the date of the contribution.
Contributions for capital projects, endowments, and similar funds are reported as non-operating revenues.
Conditional promises to donate to the university are not recognized until the conditions are substantially met.
Investment Distribution
Amount: $418M (FY 2023)
The Board of Trustees, in consultation with the finance committee, is responsible for the university’s endowment payout (distribution) policy.
The board approves the endowment payout for the coming fiscal year at the January meeting.
The payout is set annually by the Board of Trustees within a range of 4.4% of a twenty-eight-quarter rolling average, plus or minus 0.75%. Our target is not to exceed 5% of the twenty-eight-quarter value.
Endowment Payout
Historical Withdrawals of the Long-Term Investment Pool (LTIP)
| Long-Term Investment | F23 Actual | FY22 Actual | FY21 Actual | FY20 Actual | FY19 Actual |
|---|---|---|---|---|---|
| LTI Rate of Return | 3.6% | -1.3% | 41.9% | 1.90% | 5.30% |
| LTIP Annual Payout Rate per Share | $2.57 | $2.39 | $2.45 | $2.45 | $2.48 |
| LTIP Payout Distributed (millions) | $332.78 | $301.84 | $300.23 | $292.40 | $290.40 |
| LTIP Admin Fee (millions) | $53.69 | $50.02 | $49.78 | $48.61 | $44.30 |
| LTIP Special Distribution (millions) | $15.00 | $86.30 | |||
| Total LTIP Withdrawal (millions) | $386.47 | $351.86 | $365.01 | $427.31 | $334.70 |
Medical College Physician Income
Amount: $1,362M (FY 2023)
Weill Cornell Medicine's Medical Physician Organization income includes clinical practice income from professional services to patients and revenues generated by physician members conducting instructional and research activities.
Auxiliary Enterprise: Nonacademic Sales and Services
Amount: $202M (FY 2023)
An auxiliary enterprise is a non-academic entity that exists predominantly to furnish goods or services to students, faculty, or staff, and that charges a fee directly related to, although not necessarily equal to, the cost of the goods or services.
The university’s auxiliary enterprises include housing, dining, conference services, and retail operations (Cornell Store).
Educational Activities Sales and Services: Academic-Related Sales and Services
Amount: $902M (FY 2023)
This amount includes revenues associated with non-credit education-related programs and other sales and service activities that occur in many units throughout the university.
Examples of such programs include executive education programs, Statler Hotel, Cornell University Hospital for Animals, royalty income, athletic programs and ticket revenue, rental income, student health insurance premiums, and Weill Cornell Medicine-Qatar.
Net Assets Released from Restrictions
Amount: $0 (FY 2023)
This amount represents the transfers of funds from temporarily restricted net assets to unrestricted net assets resulting from the satisfaction of donor-imposed stipulations concerning timing or purpose.
Operating Expenses: Cornell’s Mission-Related Spending
Operating expenses are costs incurred in fulfilling the Cornell’s primary mission of "learning, discovery, and engagement."
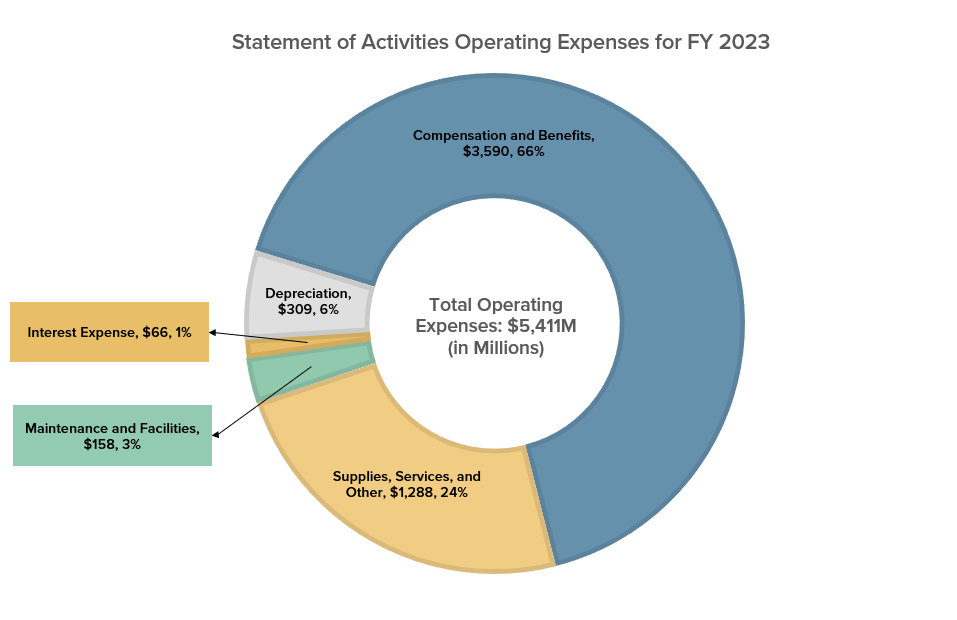
To fulfill Cornell's primary missions, operating expenses consist primarily of salary and benefits and maintenance costs for facilities and services.
Non-Operating Revenues and Expenses: Cornell’s Non-Mission-Related Income and Spending
Non-operating revenues and expenses are not directly related to the university’s primary operating mission but represent activities that indirectly support its mission and are critical components of its financial performance.
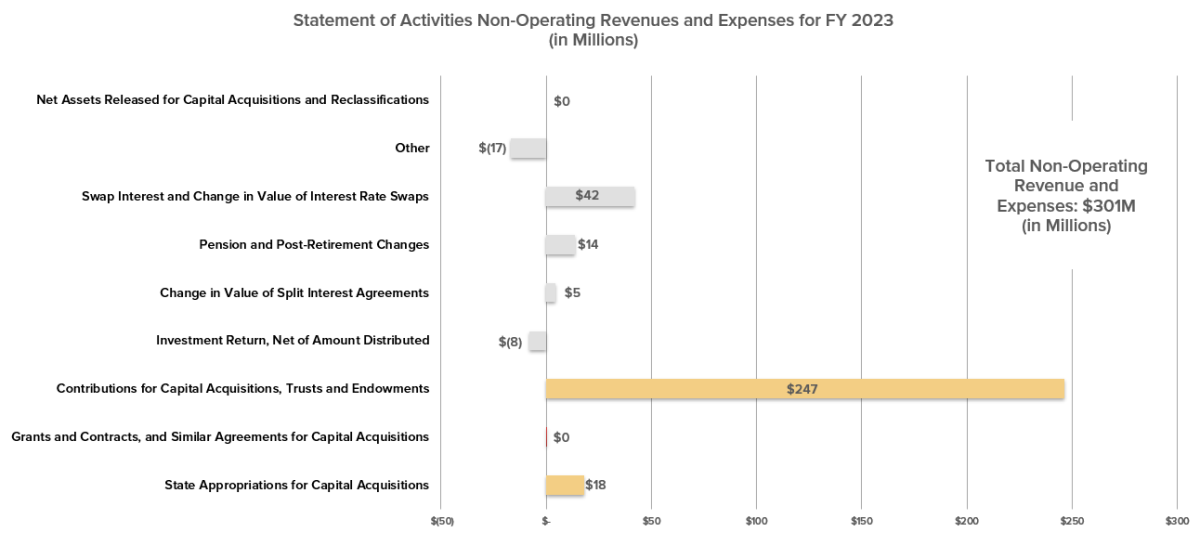
Major non-operating revenues include the realized gains or losses and unrealized valuation adjustments (investment return) less the amounts used to support operating expenses, and resources that support facilities. Major non-operating expenses include pension and post-retirement benefits and valuation adjustments.
Non-Operating Revenue and Expenses table