Cornell's Health in Ratios
Ratios Over Time
Cornell uses ratios to represent important financial measurements from year to year.
Asset Performance Over Time
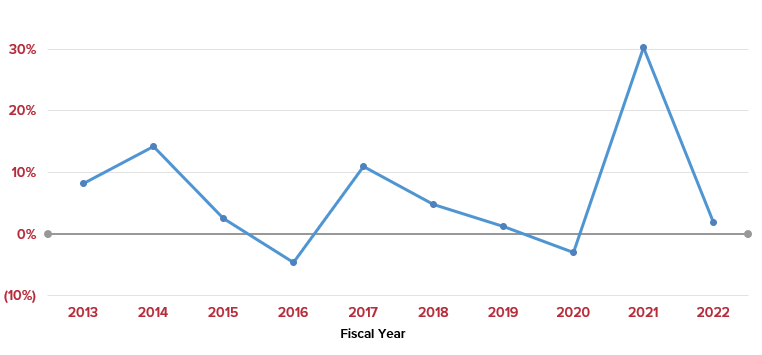
This ratio measures asset performance and helps determine whether Cornell is effectively managing its assets and whether its financial position has improved compared to prior years.
Return on Net Assets = Change in Net Assets / Beginning Net Assets
Cornell's Return on Net Assets
A determination whether Cornell's financial position has improved compared to prior years.
Cornell's Return on Net Assets table
Understanding this Ratio
A declining ratio may be appropriate if the University's strategy includes increased expenditures to better fulfill its mission. On the other hand, an improving trend in the ratio indicates that the institution is increasing its overall value (net assets) and is better positioned for future financial flexibility.
It is best to look at the ratio over the long term. It is also important to understand the underlying causes of the change in net assets, as there are volatile factors that can affect net assets such as investment return and investment in plant.
Operating Revenue to Faculty Ratio
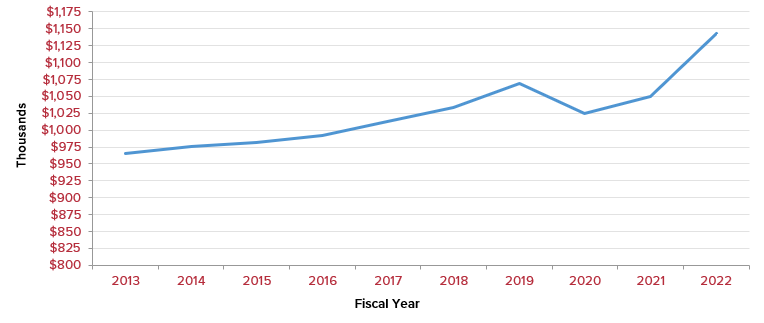
This is the ratio of operating revenue dollars per full-time, academic faculty member.
Operating Revenue to Faculty Ratio = $ Operating Revenue / Full-Time Academic Faculty Count
Cornell's Operating Revenue to Faculty Ratio
Operating revenue dollars per full-time, academic faculty member.
Cornell's Operating Revenue to Faculty Ratio table
Understanding this Ratio
Faculty play a key role in Cornell's goal of acheiving world pre-eminence in research, scholarship and creativity.
To acheive this goal, Cornell must attract and retain top faculty to bring in needed resources. This ratio tracks operating revenue and faculty, which are two critical resources necessary to fulfilling the institution's mission.
Investment Return Impact on Overall Performance
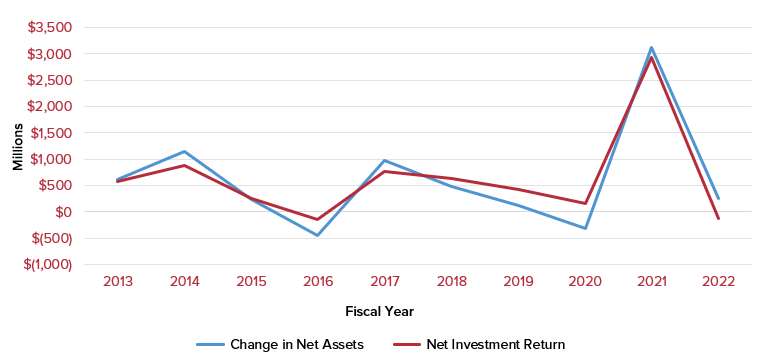
This shows the Net Investment Return and its impact on Cornell’s overall financial performance (Change in Net Assets).
Net Investment Return = Interest and Dividends, net of investment fees + Net Realized Gain or Loss + Net Unrealized Gain or Loss
Cornell's Change in Net Assets vs. Net Investment Return
Impact of investment return on Cornell's overall financial performance.
Cornell's Change in Net Assets vs. Net Investment Return table
Understanding this Ratio
This ratio demonstrates the change in value of net assets from fiscal year to fiscal year. The trend follows the investment return and the goal is to have a positive change each year. Net assets are viewed as the financial wealth of a University, similar to owner’s equity in a corporation.
Cornell's Net Return Percentage on Long-Term Investments
The net return on all Cornell’s investments is not limited to only the Long-Term Investment Pool (LTIP), although the LTIP makes up a majority of the total investments.
Net Return Percentage = Net Investment Return / Investment Assets, beginning of the current fiscal year
Measure of investment performance compared to Cornell's benchmark (Strategic Investment Policy).
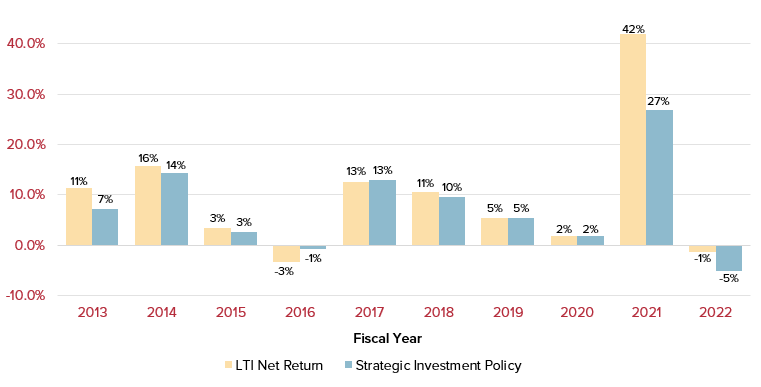
Cornell's Net Return Percentage on Long-Term Investments table
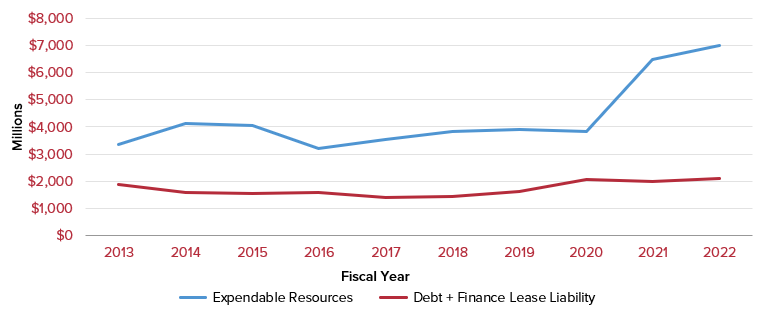
Expendable Resources Compared to Debt
This measures the level of debt obligation in comparison to the level of resources that are expendable based on net asset classification (i.e., available to meet those obligations).
Cornell's Expendable Resources vs. Debt
The level of debt obligation compared to expendable resources.
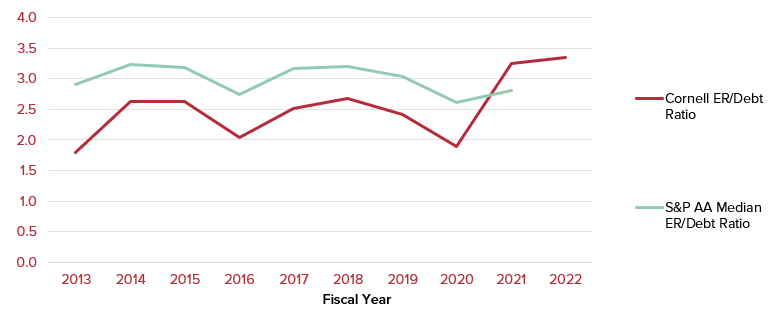
Cornell's Expendable Resources to Debt Ratio
Measures the coverage of direct debt by financial resources that are ultimately expendable.
Cornell's Expendable Resources to Debt Ratio table
Understanding this Ratio
Comparing Cornell’s total expendable resources to its total debt provides an indicator of Cornell's ability to cover its debt obligation. Although the total outstanding debt is not payable at once, monitoring debt levels and trends compared to the total expendable resources is part of strategic debt management.